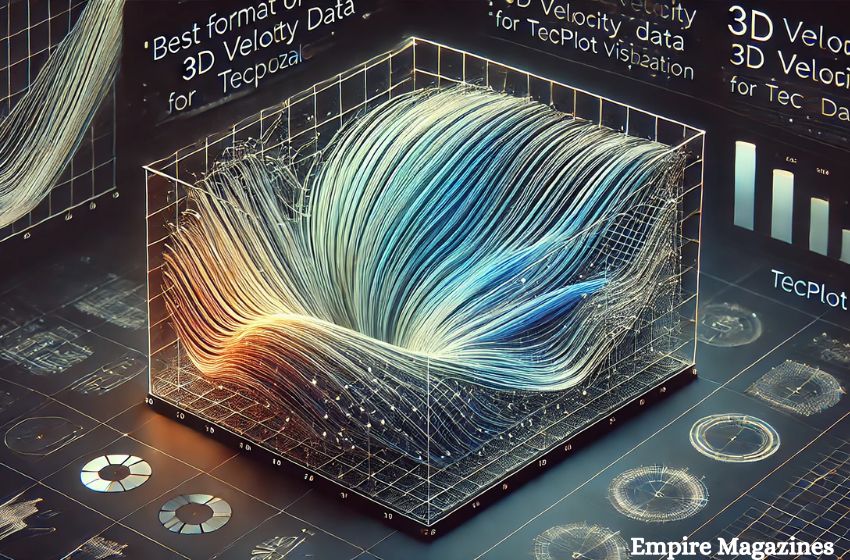
Understanding the best format of 3D velocity data for Tecplot visualization is essential for scientists, engineers, and data analysts who need to process large and complex datasets. Tecplot is a powerful post-processing tool that excels in handling Computational Fluid Dynamics (CFD) data, particularly for visualizing 3D velocity fields. The format you choose for your data can have a significant impact on processing speed, memory usage, and the quality of your visualizations. In this article, we will explore the best format options for 3D velocity data and how to optimize them for Tecplot visualization.
Why Format Matters in 3D Velocity Data Visualization
When dealing with 3D velocity data, the format in which the data is stored determines how efficiently Tecplot can handle it. With large and complex datasets generated from simulations, the format affects the memory footprint, loading times, and overall performance of the software. Choosing the right format is crucial for ensuring that your visualizations are accurate, interactive, and scalable, even for large data sets.
Commonly Used Formats in Tecplot
1. Tecplot PLT Format
The most recommended format for 3D velocity data in Tecplot is the PLT format. PLT is Tecplot’s proprietary binary format, designed specifically for efficiency. It is widely used for CFD data, especially when dealing with large and time-dependent datasets. Unlike ASCII formats, PLT files are smaller, load faster, and consume less memory during processing. This makes PLT the optimal choice for users looking for high-speed visualization with minimal resource consumption.
- Advantages of PLT Format:
- High processing speed due to binary structure
- Low memory consumption
- Compatibility with large and time-varying datasets
- Efficient for both structured and unstructured meshes
2. PLOT3D Format
Another format supported by Tecplot is PLOT3D, which is widely used for structured grid data in CFD. While PLOT3D is also efficient, it is more commonly applied to datasets with simpler structures and where memory usage is less of a concern. PLOT3D files can store both grid and solution data, making them versatile for various types of velocity fields.
- Advantages of PLOT3D:
- Can store grid and solution data
- Good for structured datasets
- Useful in parametric studies
3. ASCII Format
While Tecplot supports ASCII format, it is generally less efficient for large 3D velocity datasets. ASCII files are human-readable but significantly larger and slower to load compared to binary formats like PLT. For small datasets or cases where transparency and data readability are more critical than performance, ASCII might still be a useful option.
- Advantages of ASCII:
- Readable and editable by humans
- Easier to debug or modify directly
- Not ideal for large or complex datasets due to performance issues
Handling Unstructured Mesh Data
Unstructured meshes, which are often used in turbulent flow simulations, pose additional challenges for data visualization. These meshes are irregular and have more complex grid structures compared to structured meshes. Tecplot handles these through its efficient use of binary formats like PLT, which optimize data storage and processing.
For 3D velocity data on unstructured meshes, the PLT format once again proves to be the best option. It reduces the memory usage during visualization, making it possible to analyze large datasets with greater ease and speed.
Best Practices for 3D Velocity Data in Tecplot
1. Use Binary Formats for Large Data Sets
For large-scale 3D velocity data, always opt for binary formats like PLT. These formats minimize memory usage and significantly reduce the time it takes for Tecplot to load and render the data. In contrast, using ASCII format with large datasets can lead to increased loading times and higher memory consumption, which may slow down the entire analysis process.
2. Optimize Data Storage
Before exporting data to Tecplot, ensure that unnecessary variables are removed from the dataset. This reduces the size of the file and makes the visualization process more efficient. Tecplot allows you to selectively import variables, so focusing only on velocity components and critical data points can improve performance.
Advanced Visualization Techniques in Tecplot
1. Animation for Time-Dependent Data
For 3D velocity data that changes over time, Tecplot supports animation features, allowing users to visualize fluid motion dynamically. This feature is particularly useful for unsteady flow simulations, where changes in velocity fields occur over time. The best format for such data remains the PLT format due to its ability to handle time-varying data efficiently.
2. Interactive 3D Visualization
Tecplot offers interactive 3D visualization, enabling users to zoom, pan, and rotate the model in real-time. With unstructured meshes, this feature allows users to explore complex velocity fields more intuitively. Tecplot’s binary formats (PLT) ensure that these interactions remain smooth even with large datasets.
Empire Magazines: Your Source for Data Visualization Insights
At Empire Magazines, we aim to provide the latest insights into data visualization techniques, including the best tools and formats for complex data like 3D velocity fields. Whether you’re an engineer, scientist, or data analyst, understanding the right format for Tecplot visualization is crucial for optimizing your workflow and achieving high-quality results.
Conclusion: Choosing the Best Format of 3D Velocity Data for Tecplot Visualization
In summary, the best format for 3D velocity data for Tecplot visualization is the PLT format. It outperforms other formats like ASCII and PLOT3D in terms of speed, memory usage, and scalability, making it the optimal choice for large datasets and unstructured meshes. Whether you’re visualizing turbulent flow or running time-dependent simulations, Tecplot’s ability to handle complex data efficiently can be maximized by selecting the right format.
At Empire Magazines, we believe that mastering the right techniques and formats for data visualization is essential for unlocking the full potential of your analysis. Stay tuned for more insights and updates on best practices in data visualization.

